CDER Statistical Studies Innovate Measures of Adhesion to Assess Generic Products
Drugs and the technologies used to deliver them evolve rapidly, and methods to evaluate them must be continually adapted to ensure the safety and efficacy of new medicines. An excellent illustration of this process of adaptation is recent work by Center for Drug Evaluation and Research (CDER) statisticians who developed innovative and more efficient ways to evaluate a class of products that deliver drugs via the skin. The improved statistical analysis methods greatly enhance the power of drug development studies to provide conclusive results and have led to revised recommendations in CDER guidances. These revisions enhance the ability to develop high-quality generics of these products.
“Traditional” Evaluation of Delivery System Adhesion to Skin
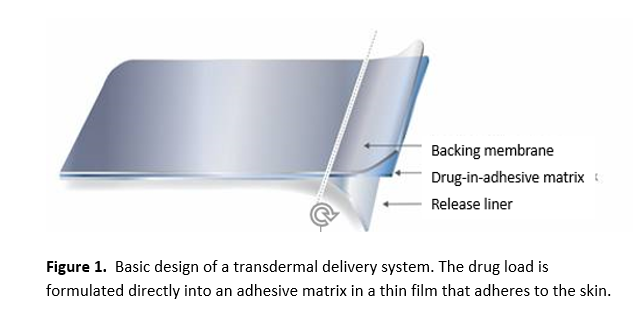
Transdermal and topical delivery systems (collectively called TDS) are preparations of drugs that are typically dissolved or suspended in a mixture of components, including adhesives, for application to intact skin. These systems may be designed to deliver the drug locally (topical drug delivery) or through the skin into the systemic circulation (transdermal drug delivery). Drugs delivered via TDS are used to treat a wide variety of diseases and conditions, including high blood pressure, angina, hormone deficiencies, and depression; the availability of high-quality, safe, effective, and affordable generics of these products is essential to millions of patients. An example of a transdermal delivery system is shown in Figure 1, but TDS may include additional layers and/or more complex designs.
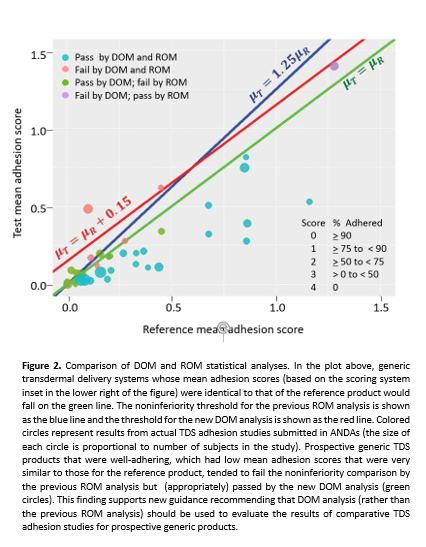
A critical expectation for TDS products is that they should adhere to the patient’s skin throughout the intended duration of wear. Thus, developers of generic TDS products must satisfy multiple criteria, including 1) bioequivalence of drug substance(s); 2) evidence that the generic TDS products do not have a greater potential to cause skin reactions compared to the reference product; and 3) verification that the adhesion of the generic TDS is not inferior to that of the reference product. To demonstrate that a product is well adhering, the surface area of adhesion to the skin is measured in a randomized study of the reference product and the generic TDS at specific time points; adherence is scored using a numerical scale from 0 (essentially no detachment) to 4 (completely detached), and the scores for study subjects are averaged for each time point. Traditionally, the test TDS products have been considered to have noninferior adhesion compared to the reference TDS if the upper bound of the 95% confidence interval of the test/reference ratio of mean adhesion scores was less than 1.25. (A smaller number for the ratio means better adhesion for the test TDS product, as a score of 0 indicates essentially no detachment.)
The Problem of Power
Statistical “power” in this context is the probability that the statistical test will correctly identify a product’s adhesion as noninferior (i.e., acceptable) compared to the reference product. The power of the established statistical analysis depended upon the specific ratio of the test and reference mean adhesion scores, as well as the variability in the data. In many instances, the statistical analyses of TDS adhesion have been potentially undermined by relatively low power (owing to high data variability), so that it was necessary to compensate for this potential study weakness by including greater numbers of subjects to adequately power the study.1
As noted by CDER statisticians, the power of the ratio of means (ROM) test also decreases as the adhesion score of the reference product improves (becomes lower). With the general improvement in adhesion of TDS reference products in recent decades, it became very difficult to demonstrate that a well-adhering (i.e., those with a mean adhesion score close to 0, indicating near-perfect adhesion across the duration of wear) test product exhibited noninferior (i.e., acceptable) adhesion based on ROM – even if very large studies were conducted.
A Better Standard for Noninferiority of Generic TDS Products
To maintain high statistical power regardless of the adhesion score of TDS reference products, CDER statisticians have developed an innovative solution. Instead of evaluating similarity of adhesion between test and reference scores as the ROM adhesion scores, CDER statisticians turned to a comparison based on the difference of mean (DOM) adhesion scores. As opposed to the previous noninferiority threshold of a test/reference ratio of less than 1.25, CDER experts determined that the more appropriate noninferiority threshold would be based on the difference in the test product and reference product overall mean adhesion scores, with a noninferiority margin of 0.15 (i.e., 15%).
Computer simulations were conducted to compare the power of the two approaches (ROM vs. DOM) while varying critical parameters such as study size (number of subjects) and variability (e.g., across adhesion scores in a given subject) for a range of different test and reference product adhesion scores (i.e., for TDS spanning the range from well adhering to poorly adhering). These simulations demonstrated that the low power of the traditional ROM approach was due to the (numerically) small values of the scores for well adhering brand name (reference) products.2 These investigations showed that the DOM approach would provide much higher power to correctly conclude that well-adhering test products exhibited noninferior adhesion compared to a well-adhering reference product, without increasing the probability of mistakenly concluding that a poorly adhering test product showed acceptable, noninferior adhesion (i.e., type 1 error was controlled at the same level). This work led to the issuance of a new draft guidance for industry that recommends using the more powerful DOM method rather than the previous ROM method for the statistical noninferiority analysis when comparing the adhesion performance of prospective generic TDS to its corresponding reference TDS product.
To determine how well the DOM approach would work with real world data (as opposed to the computer simulations that were performed during the development of the revised guidance), CDER statisticians looked at 40 studies comparing the adhesion of test and reference TDS products that had been submitted to the FDA in applications for generic TDS products and applied the updated recommendations in the new draft guidance. Among these products were 15 prospective generic TDS that had been compared to moderately-to-well adhering reference products that would have failed the previous ROM analysis due to its low power (green circles in Figure 2). These products were found to have noninferior adhesion compared to the reference product thanks to the much greater power of the new approach using DOM analysis.
How does this work advance medical product development?
The new statistical analysis approach developed by CDER statisticians made it feasible for generic TDS product manufacturers to demonstrate that a well-adhering test product was noninferior to a well-adhering reference product without the need to conduct a study that would have to be so large to be sufficiently powered that it would be beyond the resources of the sponsor. The new approach thereby eliminated a major barrier to the availability of high-quality, well-adhering generic TDS products for patients.
1For a description the statistical models on which the ROM and DOM tests are based, see Sun, W., Grosser, S., Kim, C., & Raney, S. G. (2019) Statistical considerations and impact of the FDA draft guidance for assessing adhesion with transdermal delivery systems and topical patches for ANDAs. Journal of biopharmaceutical statistics, 29(5), 952-970.
2These simulations ruled out a potential additional cause for lower power, non-normality of the data (see Sun et al. (2019) for further details).


Comments
Post a Comment